Electrify Chicago
According to the
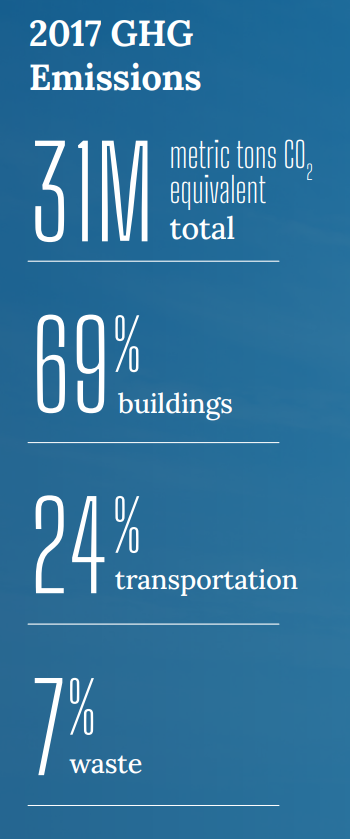
2022 Chicago Climate Action Plan ,
a whopping 69% of Chicago's emissions come from buildings, making it
our biggest challenge and our biggest opportunity as a city to tackle
change. At Electrify Chicago we want to showcase some of the best and worst performing
buildings in the city using publicly available data and manual annotations to add
building photographs and label multi-building owners like universities.
,
a whopping 69% of Chicago's emissions come from buildings, making it
our biggest challenge and our biggest opportunity as a city to tackle
change. At Electrify Chicago we want to showcase some of the best and worst performing
buildings in the city using publicly available data and manual annotations to add
building photographs and label multi-building owners like universities.
You can start by looking at Chicago's buildings with the highest greenhouse gas intensity - this means that they use the most energy when adjusted per unit of square foot, so big buildings could actually perform much better than very inefficient small buildings on this metric.
Chicago Buildings by Greenhouse Gas Intensity
Note: Data only includes large Chicago buildings from 2020
Note: This data only includes buildings whose emissions are reported
under the
Chicago Energy Benchmarking Ordinance. According to the City “As of 2016,
this list includes all commercial, institutional, and residential buildings larger than
50,000 square feet.” This dataset is also then filtered to only buildings with
reported emissions > 1,000 metric tons CO2 equivalent.
This data is also from 2020, but when new benchmark data is available, we'll update the site.
| Property Name / address | Primary Property Type |
Greenhouse Gas Intensity (kg CO2 eq./sqft) |
Total Greenhouse Emissions (metric tons CO2 eq.) |
|---|---|---|---|
|
Aqua at Lakeshore East
🚩
📷
225 N Columbus Dr
| Multifamily Housing | 5.4 kg/sqft
Lowest 30%
| 8,388 tons
Highest 3%
|
|
Emerald Condo
123 - 125 S Green St
| Multifamily Housing | 5.4 kg/sqft
Lowest 30%
| 1,632 tons
Highest 29%
|
|
Renaissance Lofts
1783 1791 W HOWARD ST
| Multifamily Housing | 5.4 kg/sqft
Lowest 30%
| 324 tons
Lowest 11%
|
|
6334 N Sheridan Condominium Association
6334 6344 N SHERIDAN RD
| Multifamily Housing | 5.4 kg/sqft
Lowest 30%
| 343 tons
Lowest 13%
|
|
100 W. Chestnut St.
100 W Chestnut St
| Multifamily Housing | 5.4 kg/sqft
Lowest 30%
| 1,589 tons
Highest 30%
|
|
Presidential Towers (ps19)
🚩
555 W Madison St
| Multifamily Housing | 5.4 kg/sqft
Lowest 30%
| 11,371 tons
Highest 2%
|
|
AG One East Delaware Owner, LLC
1 E Delaware Pl
| Multifamily Housing | 5.4 kg/sqft
Lowest 30%
| 2,752 tons
Highest 15%
|
|
Buena Pointe Condominium Association
4344 4360 N BROADWAY
| Multifamily Housing | 5.4 kg/sqft
Lowest 30%
| 815 tons
Lowest 47%
|
|
65 E Wacker Place
65 E Wacker Pl
| Office | 5.4 kg/sqft
Lowest 30%
| 1,349 tons
Highest 35%
|
|
4651 N Greenview (ng55)
4651 N GREENVIEW AVE
| Multifamily Housing | 5.4 kg/sqft
Lowest 30%
| 368 tons
Lowest 15%
|
|
The Larrabee Condominium Association
865 N LARRABEE ST
| Multifamily Housing | 5.4 kg/sqft
Lowest 30%
| 431 tons
Lowest 20%
|
|
City-Towne Condominium Association
517 525 N HALSTED ST
| Multifamily Housing | 5.4 kg/sqft
Lowest 30%
| 482 tons
Lowest 25%
|
|
1001 Madison Condominium Association
1001 W MADISON ST
| Multifamily Housing | 5.4 kg/sqft
Lowest 30%
| 686 tons
Lowest 40%
|
|
3300 North Lake Shore Drive
3300 3308 N LAKE SHORE DR
| Multifamily Housing | 5.4 kg/sqft
Lowest 30%
| 751 tons
Lowest 44%
|
|
The Chatelaine
211 217 E CHESTNUT ST
| Multifamily Housing | 5.4 kg/sqft
Lowest 30%
| 510 tons
Lowest 27%
|
Data Source:
Chicago Energy Benchmarking Data