Electrify Chicago
According to the
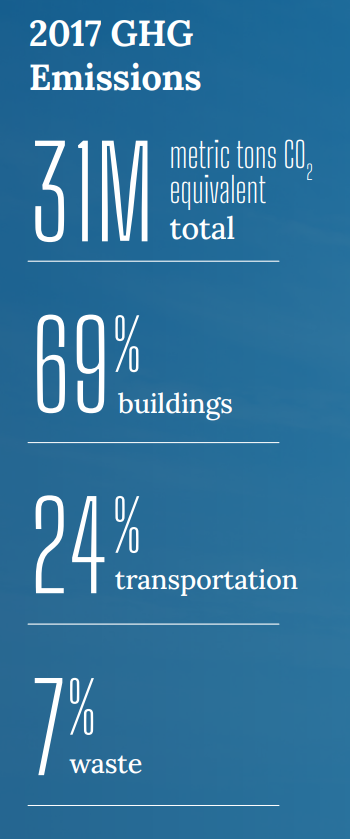
2022 Chicago Climate Action Plan ,
a whopping 69% of Chicago's emissions come from buildings, making it
our biggest challenge and our biggest opportunity as a city to tackle
change. At Electrify Chicago we want to showcase some of the best and worst performing
buildings in the city using publicly available data and manual annotations to add
building photographs and label multi-building owners like universities.
,
a whopping 69% of Chicago's emissions come from buildings, making it
our biggest challenge and our biggest opportunity as a city to tackle
change. At Electrify Chicago we want to showcase some of the best and worst performing
buildings in the city using publicly available data and manual annotations to add
building photographs and label multi-building owners like universities.
You can start by looking at Chicago's buildings with the highest greenhouse gas intensity - this means that they use the most energy when adjusted per unit of square foot, so big buildings could actually perform much better than very inefficient small buildings on this metric.
Chicago Buildings by Greenhouse Gas Intensity
Note: Data only includes large Chicago buildings from 2020
Note: This data only includes buildings whose emissions are reported
under the
Chicago Energy Benchmarking Ordinance. According to the City “As of 2016,
this list includes all commercial, institutional, and residential buildings larger than
50,000 square feet.” This dataset is also then filtered to only buildings with
reported emissions > 1,000 metric tons CO2 equivalent.
This data is also from 2020, but when new benchmark data is available, we'll update the site.
| Property Name / address | Primary Property Type |
Greenhouse Gas Intensity (kg CO2 eq./sqft) |
Total Greenhouse Emissions (metric tons CO2 eq.) |
|---|---|---|---|
|
East Park Tower
5236 5252 S HYDE PARK BLVD
| Multifamily Housing | 4.3 kg/sqft
Lowest 13%
| 587 tons
Lowest 34%
|
|
The Metro
1200 W MONROE
| Multifamily Housing | 4.3 kg/sqft
Lowest 13%
| 1,206 tons
Highest 38%
|
|
616 Fulton Lofts Condominium Association
616 W FULTON ST
| Multifamily Housing | 4.3 kg/sqft
Lowest 13%
| 695 tons
Lowest 41%
|
|
2550 S Wabash
2550 2558 S WABASH AVE
| Multifamily Housing | 4.3 kg/sqft
Lowest 13%
| 294 tons
Lowest 9%
|
|
Keller Center
1307 E 60TH ST
| College/University | 4.3 kg/sqft
Lowest 13%
| 522 tons
Lowest 29%
|
|
Printers Row Lofts
722 740 S FINANCIAL PL
| Multifamily Housing | 4.3 kg/sqft
Lowest 13%
| 859 tons
Lowest 49%
|
|
227-237 E Delaware Place
227 239 E DELAWARE PL
| Multifamily Housing | 4.3 kg/sqft
Lowest 13%
| 854 tons
Lowest 49%
|
|
517-25 W. Brompton Ave.
517 525 W BROMPTON AVE
| Multifamily Housing | 4.3 kg/sqft
Lowest 13%
| 225 tons
Lowest 4%
|
|
440 W Barry LLC
440 442 W BARRY AVE
| Multifamily Housing | 4.2 kg/sqft
Lowest 12%
| 283 tons
Lowest 8%
|
|
Southeast Area Elementary School
3930 E 105th Street
| K-12 School | 4.2 kg/sqft
Lowest 12%
| 464 tons
Lowest 24%
|
|
Harding Court
4845-4859 N Harding
| Multifamily Housing | 4.2 kg/sqft
Lowest 12%
| 217 tons
Lowest 3%
|
|
Francisco
4011 N Francisco Avenue
| Multifamily Housing | 4.2 kg/sqft
Lowest 12%
| 231 tons
Lowest 4%
|
|
Parkside IIB
459 W Division St
| Multifamily Housing | 4.2 kg/sqft
Lowest 12%
| 597 tons
Lowest 35%
|
|
Parkside Terrace Apartments
137-143 N Parkside Ave
| Multifamily Housing | 4.2 kg/sqft
Lowest 12%
| 355 tons
Lowest 13%
|
|
Jonathan Y Scammon Elementary School
4201 W Henderson St
| K-12 School | 4.2 kg/sqft
Lowest 12%
| 359 tons
Lowest 14%
|
Data Source:
Chicago Energy Benchmarking Data